import sys

sys.path.insert(0, "..")
import matplotlib.pyplot as plt
from _style import COLOURS, MUTED

fig, axes = plt.subplots(1, 2, figsize=(8.4, 3.4))


def box(ax, x, y, w, h, label, colour, text="white", size=9):
    ax.add_patch(plt.Rectangle((x, y), w, h, facecolor=colour, edgecolor="none"))
    ax.text(x + w / 2, y + h / 2, label, ha="center", va="center",
            color=text, fontsize=size)


def arrow(ax, x1, y1, x2, y2):
    ax.annotate("", xy=(x2, y2), xytext=(x1, y1),
                arrowprops=dict(arrowstyle="-|>", color="#aeb6bf", linewidth=1.3))


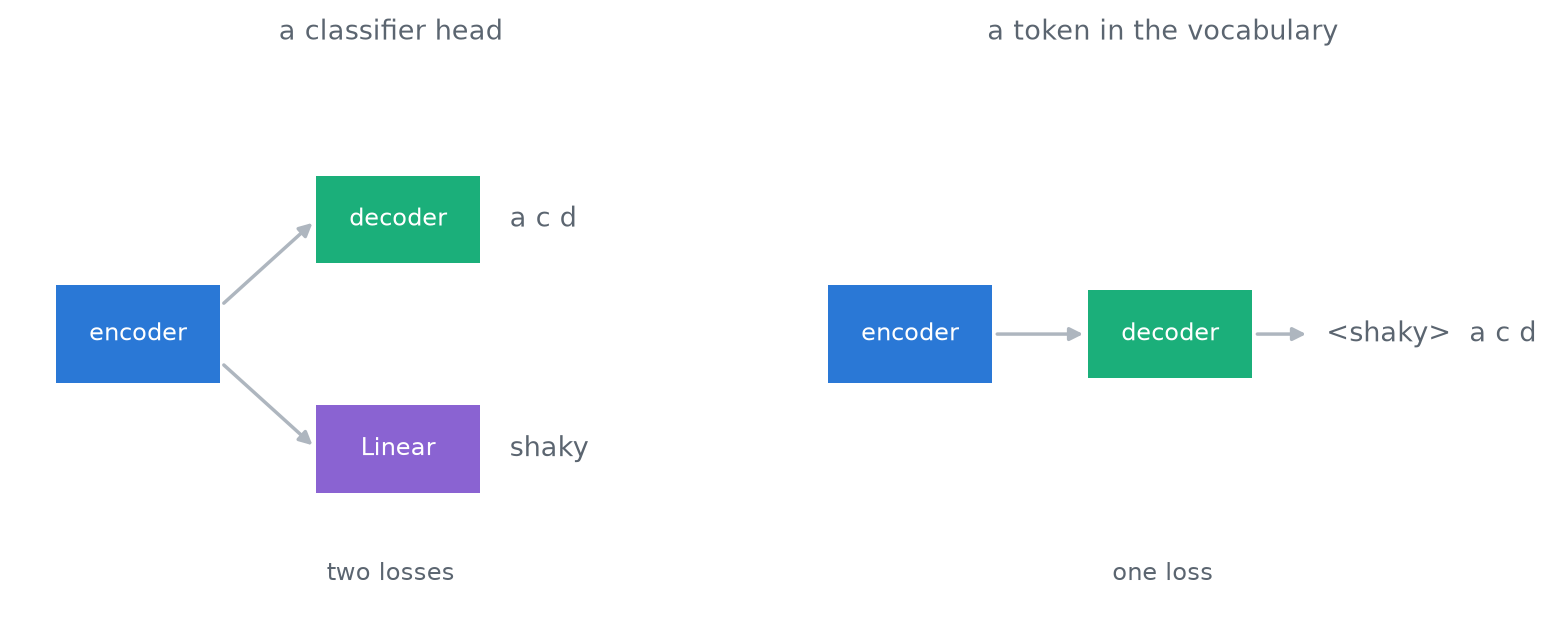
for ax, title in zip(axes, ("a classifier head", "a token in the vocabulary")):
    box(ax, 0.05, 0.42, 0.22, 0.18, "encoder", COLOURS[0])
    ax.set_title(title, fontsize=10, color=MUTED, pad=10)
    ax.set_xlim(0, 1); ax.set_ylim(0, 1); ax.axis("off")

# left: two outputs, two losses
arrow(axes[0], 0.27, 0.56, 0.40, 0.72)
arrow(axes[0], 0.27, 0.46, 0.40, 0.30)
box(axes[0], 0.40, 0.64, 0.22, 0.16, "decoder", COLOURS[2])
box(axes[0], 0.40, 0.22, 0.22, 0.16, "Linear", COLOURS[3])
axes[0].text(0.66, 0.72, "a c d", fontsize=10, color=MUTED, va="center")
axes[0].text(0.66, 0.30, "shaky", fontsize=10, color=MUTED, va="center")
axes[0].text(0.5, 0.06, "two losses", fontsize=9, color=MUTED, ha="center")

# right: one output, one loss
arrow(axes[1], 0.27, 0.51, 0.40, 0.51)
box(axes[1], 0.40, 0.43, 0.22, 0.16, "decoder", COLOURS[2])
arrow(axes[1], 0.62, 0.51, 0.70, 0.51)
axes[1].text(0.72, 0.51, "<shaky>  a c d", fontsize=10, color=MUTED, va="center")
axes[1].text(0.5, 0.06, "one loss", fontsize=9, color=MUTED, ha="center")

fig.tight_layout()