Scaling a container to zero is free until someone knocks on the door. A one-line queueing model says how often that actually happens — and where to spend the money to stop it.
Author
Rosh Beed
Published
September 18, 2026
I’m rebuilding this site as the front door to nine machine learning demos. Each one is its own container image, each one scales to zero, and each one therefore pays a cold start when it wakes up. On a multi-gigabyte image that is ten to thirty seconds of somebody staring at a spinner.
The instinct is to keep everything warm. That instinct is expensive, and mostly wrong. Before paying for it, it’s worth asking a narrower question: what fraction of requests actually hit a cold container?
The model
Take one endpoint with a single warm worker and an idle timeout \(T\) — the platform keeps the container alive for \(T\) after the last request, then reclaims it. Assume requests arrive as a Poisson process with rate \(\lambda\).
A request finds the container cold exactly when the gap since the previous request exceeded the idle timeout. For Poisson arrivals those gaps are exponential, so:
\[P(\text{cold}) = e^{-\lambda T}\]
That’s the whole model. It is crude — it ignores concurrency, platform-side reclamation before the timeout, and the fact that traffic to a portfolio site is nothing like Poisson — but it gets the shape right, and the shape is what decides the architecture.
What it looks like
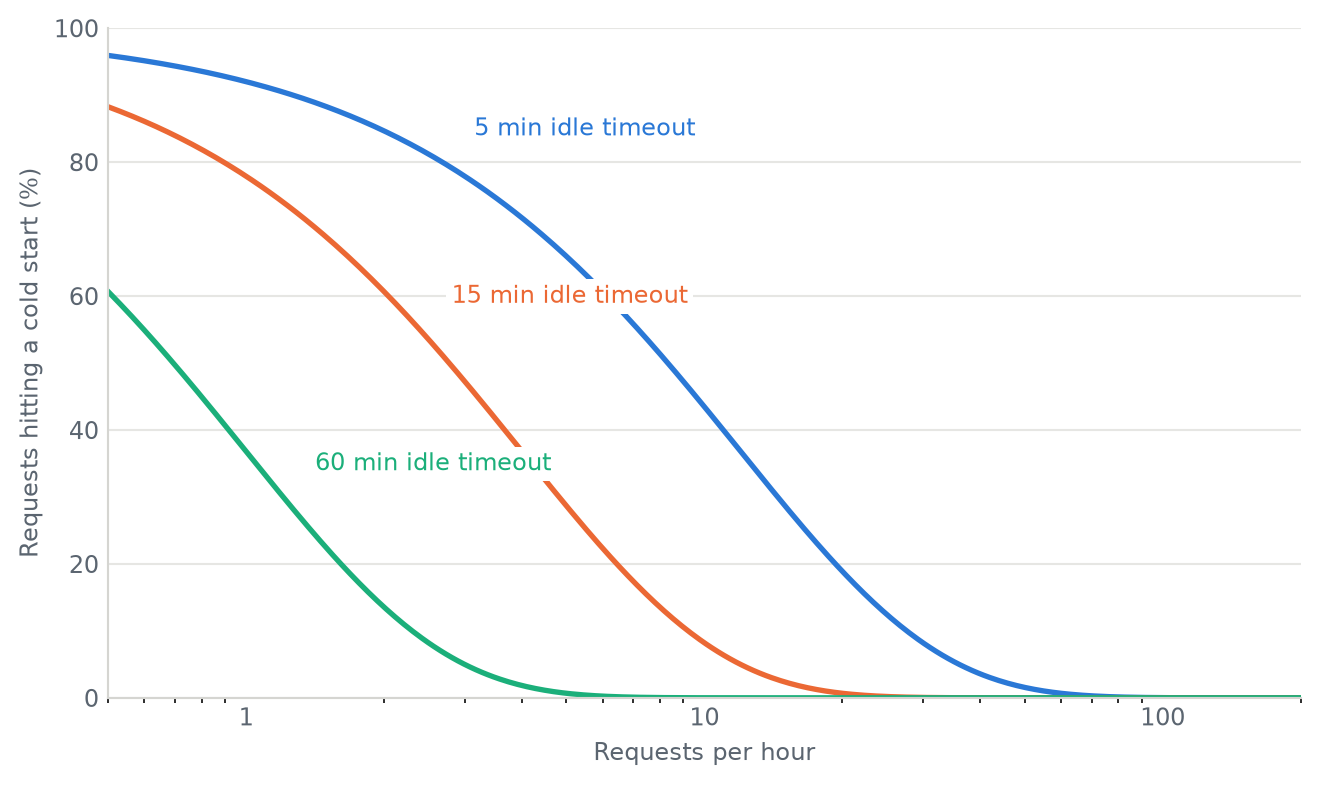
The traffic axis is logarithmic. A portfolio site lives at the left-hand end of it.
import matplotlib.pyplot as pltimport numpy as np# Categorical slots 1-3 of a CVD-validated palette (blue, orange, aqua).COLOURS = ["#2a78d6", "#eb6834", "#1baf7a"]MUTED, GRID, AXIS ="#5b6570", "#e6e6e3", "#d5d5d1"requests_per_hour = np.logspace(np.log10(0.5), np.log10(200), 400)lam = requests_per_hour /60# arrivals per minutefig, ax = plt.subplots(figsize=(7, 4.2))# Each curve is direct-labelled at a different height so the labels never# collide, on a surface-coloured halo so a neighbouring curve passing behind a# label is cleanly interrupted rather than striking through the text.for colour, timeout_min, label_at inzip(COLOURS, (5, 15, 60), (0.80, 0.55, 0.30)): p_cold = np.exp(-lam * timeout_min) ax.plot(requests_per_hour, 100* p_cold, color=colour, linewidth=2) ax.annotate(f"{timeout_min} min idle timeout", xy=(60*-np.log(label_at) / timeout_min, 100* label_at), xytext=(12, 10), textcoords="offset points", fontsize=9, color=colour, bbox=dict(facecolor="white", edgecolor="none", pad=2), )ax.set_xscale("log")ax.set_xlim(0.5, 200)ax.set_ylim(0, 100)ax.set_xticks([1, 10, 100])ax.set_xticklabels(["1", "10", "100"])ax.set_xlabel("Requests per hour", color=MUTED, fontsize=9)ax.set_ylabel("Requests hitting a cold start (%)", color=MUTED, fontsize=9)ax.grid(axis="y", color=GRID, linewidth=0.8)ax.set_axisbelow(True)for side in ("top", "right"): ax.spines[side].set_visible(False)for side in ("left", "bottom"): ax.spines[side].set_color(AXIS)ax.tick_params(colors=MUTED, labelsize=9, length=0)fig.tight_layout()plt.show()
Figure 1: Share of requests that hit a cold container, under Poisson arrivals, for three idle timeouts. Note the logarithmic traffic axis.
Two things fall out of that picture.
At low traffic, a short idle timeout is no protection at all. At 20 requests an hour — a good day for a personal site — a 5-minute timeout still leaves roughly one request in five landing cold. Shortening the tail of the curve requires traffic you do not have.
The curve is steep in the timeout, not the traffic. Going from 5 to 60 minutes of idle time buys far more than any plausible increase in visitors. Which is the useful result: if you want fewer cold starts on a quiet service, you buy idle time, not popularity.
What I’m doing with it
The nine inference endpoints stay on Lambda container images and stay scaled to zero. Their cold starts are real but they are inside an interaction the user has already committed to — they clicked “run”, and a spinner covers it honestly.
The one thing that cannot be cold is the front door. A visitor who waits twenty seconds for the first paint leaves; a visitor who waits twenty seconds for a model they asked to run does not. So the Streamlit front-end lives on something persistent with a warm instance, and the expensive-to-warm nine stay cheap.
That’s a single provisioned instance instead of ten. The model above is what makes that an argument rather than a preference.
A note on how this page was made
The figure above is not an image I committed. It is the output of the code cell you can read, executed by Quarto when this page was built, in a locked Python environment. The proof is below — it is printed at build time, so it cannot be stale:
Built:      2026-09-18 01:36:14 UTC
Python:     3.13.15
matplotlib: 3.11.2
numpy:      2.5.3